在上一篇blog《Firefox扩展调试的一些心得和技巧》中,我还没有找到办法来做到源代码级别跟踪调试,只能通过日志输出的方法。今天通过一个上午的hacking,找到了一个目前为止还算比较完美的源代码级别断点调试。
用到的工具
FireBug已经是大名鼎鼎的Firefox扩展了,可以说是每个Web开发人员的必备杀器。ChromeBug似乎知道的人比较少,而且更可笑的是,很多人以为ChromeBug是Google出品的Chrome浏览器下的一个类似Firebug的插件。真是笑话!FireBug的开发团队确实给IE、Safari、Chrome等其他浏览器开发了类似的辅助开发扩展工具,但是名字是FireBug Lite!
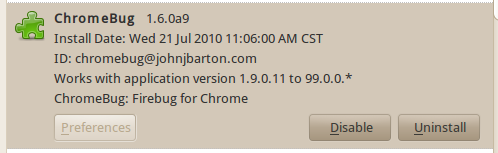
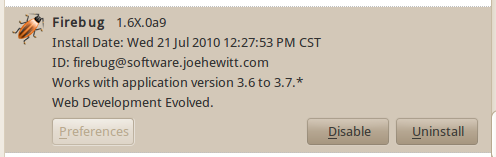
好了,科普到此为止。我最近学会的这种Firefox扩展调试的新方法就是需要用到ChromeBug和FireBug这两款扩展程序。虽然这是两个独立的扩展程序,但事实上ChromeBug是严格依赖于FireBug扩展的。这体现在,如果要实现源代码级别跟踪调试,两款扩展的版本号必须精确相同!刚开始的时候,我没有注意版本号问题。结果就是虽然都可以正常运行这两个扩展,一些基本功能也都正常。但是就是无法对chrome://下的js脚本下断点进行调试。直到我更换统一了两者的版本号为止!
写作本文时,我所使用的两款扩展的版本如图所示:
注意:为了使用ChromeBug,必须在Firefox启动时使用-chromebug参数!
ChromeBug实际上一个独立于Firefox主窗口的独立XUL程序,因此在使用了-chromebug参数启动Firefox后,会单独打开一个ChromeBug窗口。首次启动ChromeBug时,默认窗口界面上会显示一些软件使用的帮助信息,务必要仔细阅读!
我把其中的QuickStart部分摘抄如下:
The Firebug toolbar (Console, HTML, CSS, etc) apply to the current ‘context’, typically a top-level nsIDOMWindow like Firefox’s browser.xul. You can set the context from the list on the top right. Or use the Filter: in the ChromeBug menu to select the context for your debugging. Normally you will choose your extension. Or use the File: list to pick a source file and thus set the context. Once a context is set, you can select your JS files and set breakpoints, use the watch window to inspect your data, etc. in the Firebug panels. Note: Because most extensions merge their main XUL into the browser.xul, ChromeBug will not present your XUL as a debug component. To debug javascript inside of your XUL, you will be setting breakpoints in browser.xul.
简单翻译一下上面的英文:
你可以通过ChromeBug主窗口右上角的context下拉菜单选择你当前要调试的文件。或者,你可以依次通过Filter、File下拉菜单,来逐步定位到你需要调试的文件。一旦你在context菜单下选定了待调试的文件,后续的js脚本调试就和在Firebug中调试完全一样了!注意:因为绝大多数的扩展把它们自己的主XUL窗口嵌入到了浏览器的默认窗口文件(browser.xul)中,ChromeBug并不会把这个已经嵌入到主窗口的XUL文件再独立展现出来。因此,你需要通过在browser.xul中设置断点来达到调试的目的。
后记:在写这篇blog之前,还尝试过了Venkman和基于Venkman扩展的方式来实现源代码级别的chrome://脚本调试,但发现bug很多,经常会出现单步执行假死或莫名其妙跳过的情况。相比较而言,ChromeBug更稳定,也更容易上手一些。